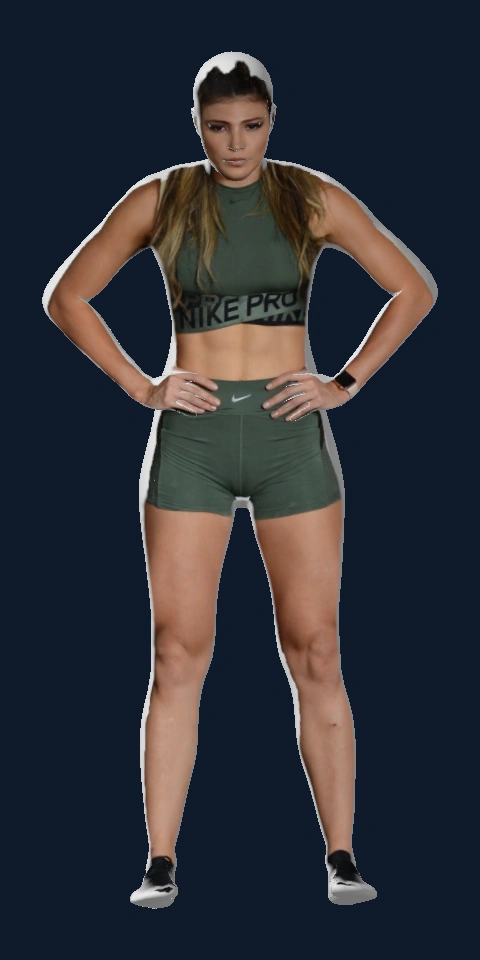
Explore the body view, switch measurements, and follow sample trends. This is a public preview, so you can see what membership includes before you join.
A 3D reconstruction from the photo shown. Unseen surfaces remain neutral. Stock-photo demonstration; tracking values are illustrative and do not describe this person. Photo: Jonathan / Pexels ↗
Illustrative tracking data
Body fat22.8 %-1.4 pp since first scanFat mass40.6 lb-3.1 lb since first scanLean mass137.5 lb+0.5 lb since first scanWaist34.0 in-1.0 in since first scan
Your waist is 49.4% of your height. In the NICE healthy central-adiposity band, which describes fat carried around the abdomen.
Category details & source
NICE adult central-adiposity bands, BMI below 35. The chart uses plain-language waist labels. Values below 0.400 sit outside the published categories. A position from scan dimensions is a numerical comparison, not a clinical risk classification.
This band corresponds to the study’s healthy-weight BMI interval for your age and sex.
Category details & source
Gallagher Table 4, female, ages 20-39; BMI-linked four-compartment research in pooled African American/white participants. Low, reference, elevated, and high are display labels for bands separated by the study’s BMI 18.5, 25, and 30 cutoffs. Not validated scan cutoffs, fitness levels, or universal health targets.
The highlighted row shows where your value falls. Screening categories provide context, not a diagnosis. Body-fat bands are provisional research comparisons, not fitness levels.
Sample interface. Tracking values are illustrative; the 3D view is a separate photo-based example.